PRIMROSe
Exploration, Visualization and Presentation of Complex Networks
In the course of my PhD studies, I've been building a tool for Visual Analysis of very large networks of interconnected data (e.g. Knowledge Graphs, ER Models, SW Architectural Models, Social Networks, and Ontologies).
Complex Networks
Complex Systems (organisms, organizations, cities and their infrastructure, entire societies, big ideas, the known universe) are composed of smaller parts –components– that interact with each other or are related in some manner.
Knowledge about these systems can be transmitted in different ways: You can have a conversation, carve hieroglyphs in stone, write a book, or draw a conceptual map. You pick an appropriate language/medium and make your best effort to tell the story.
Regardless of the medium, how would you tell the story about a complex system (e.g. a company) in sufficient amount of detail?
You can start by describing all the aspects of the business: Which are the services or goods that are produced, as well as their raw materials. Then, you can talk about the processes that transform the materials into products. Its employees and their roles, its providers, competitors, and even the regulations that it has to follow. Afterwards, you can describe all the assets of the company, as well as the technological infrastructure, the software that runs the company, and so on. Indeed, it can be a really long story.
To tell the story in an organized manner, you realize that you have to break it into smaller sub-systems –components– (i.e. assets, processes, organizational structure, technological infrastructure). Each component may be complex as well, so it must be decomposed in smaller sub-components, almost in a fractal-like manner. Another thing that you might notice is that each individual component is related to many other components.
As it happens, any complex system can be described in the simple language of networks, which consist of elements and relationships:

When described in sufficient amount of detail, we can extract new information from these complex networks: Facts that are not always evident, knowledge to better understand these systems, and ways to re-design these systems in a more desirable/optimal way.
The Problem
Currently, there are several tools for handling networked data:
- Network analysis tools such as Cytoscape and Gephi
- Visual Analysis platforms such as Tableau
- Knowledge Bases such as Obsidian and Roam Research
- Enterprise Modeling tools such as Archi and Enterprise Architect
- Ontology editors such as Protégé
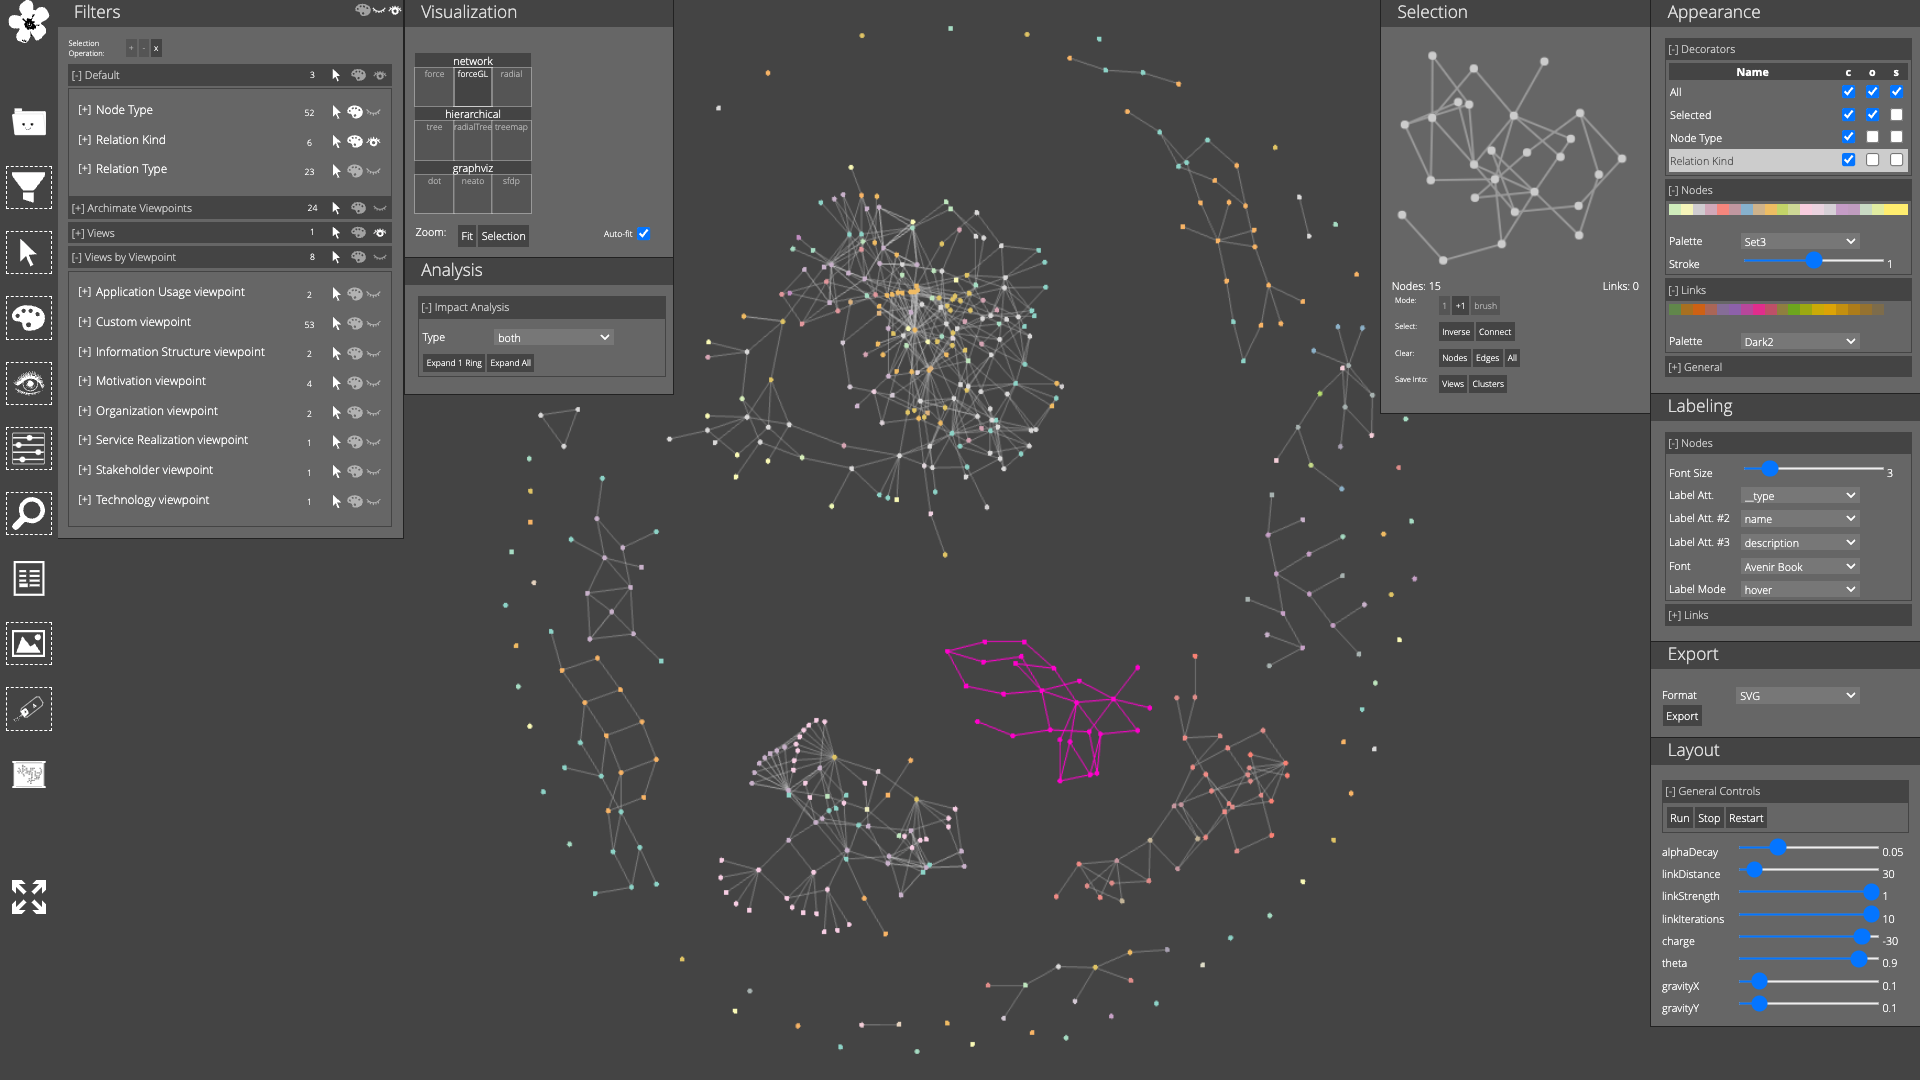
Each tool supports specific formats/languages to represent the data, and offer multiple features for visualization and analysis. While excellent in their own domains of application, what all of these tools lack is a coherent Interaction Design that allows a meaningful visual exploration of the whole network. In concrete, these tools do not have effective mechanisms for:
- Manipulating the visualization and navigating the whole dataset easily
- Selecting elements and relationships for creating custom views
- Organizing a large collection of views
- Preserving and replaying the entire exploration process
The Tool
The idea behind PRIMROSe is to facilitate the Explorative Analysis of complex networks:
Features
- Customizable User Interface, tailored for specialized exploration/visualization tasks
- Performant Visualization using Multi-threading (Web Workers) and GPU rendering (WebGL)
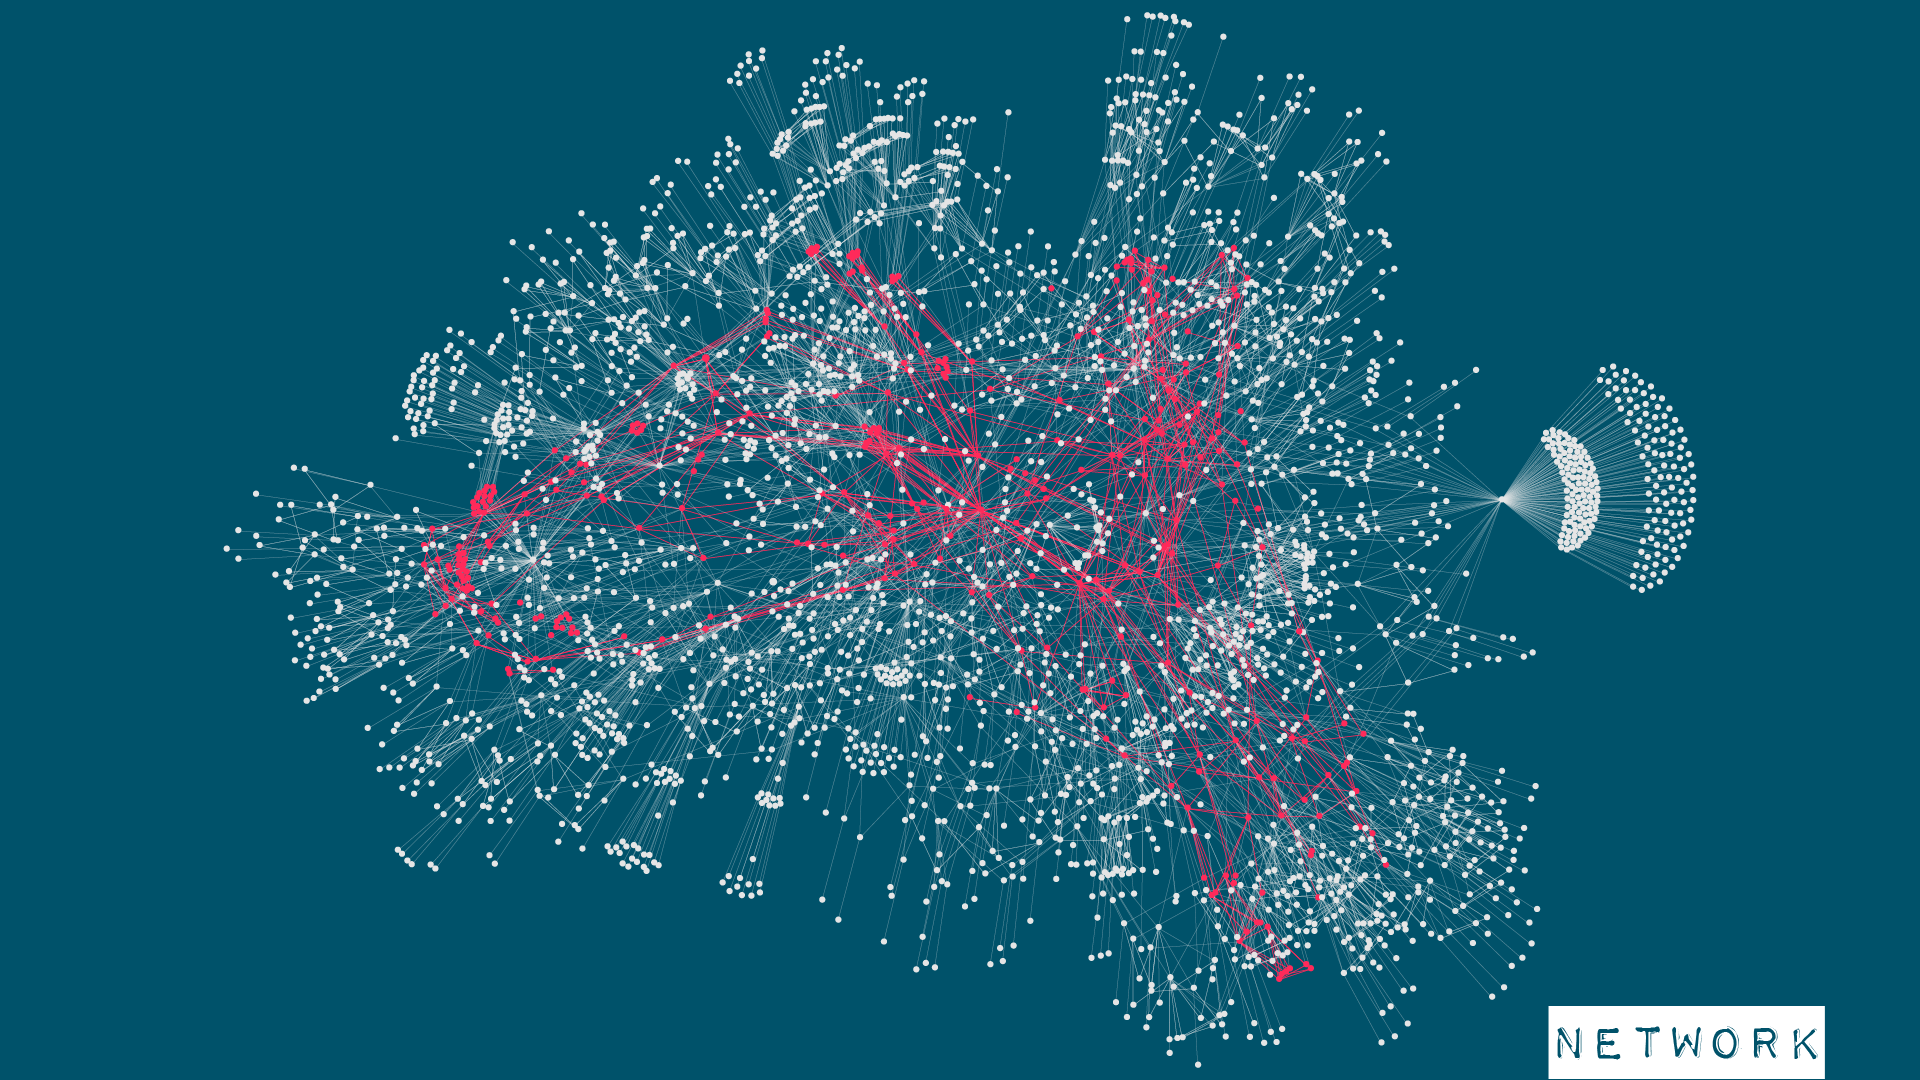
- Six Visualization Techniques and automated layout algorithms that support 600.000+ vertices and edges
- Multiple modes for selecting elements and relationships
- Easy creation of Views and Clusters
- Style rules for each View/Cluster
- Automatic interpolation of Size and Color
- Export Views as Rasterized Images (PNG) or Vectorized Graphics (SVG)
- Preserve an reproduce visually all the stages of an Exploratorive Analysis
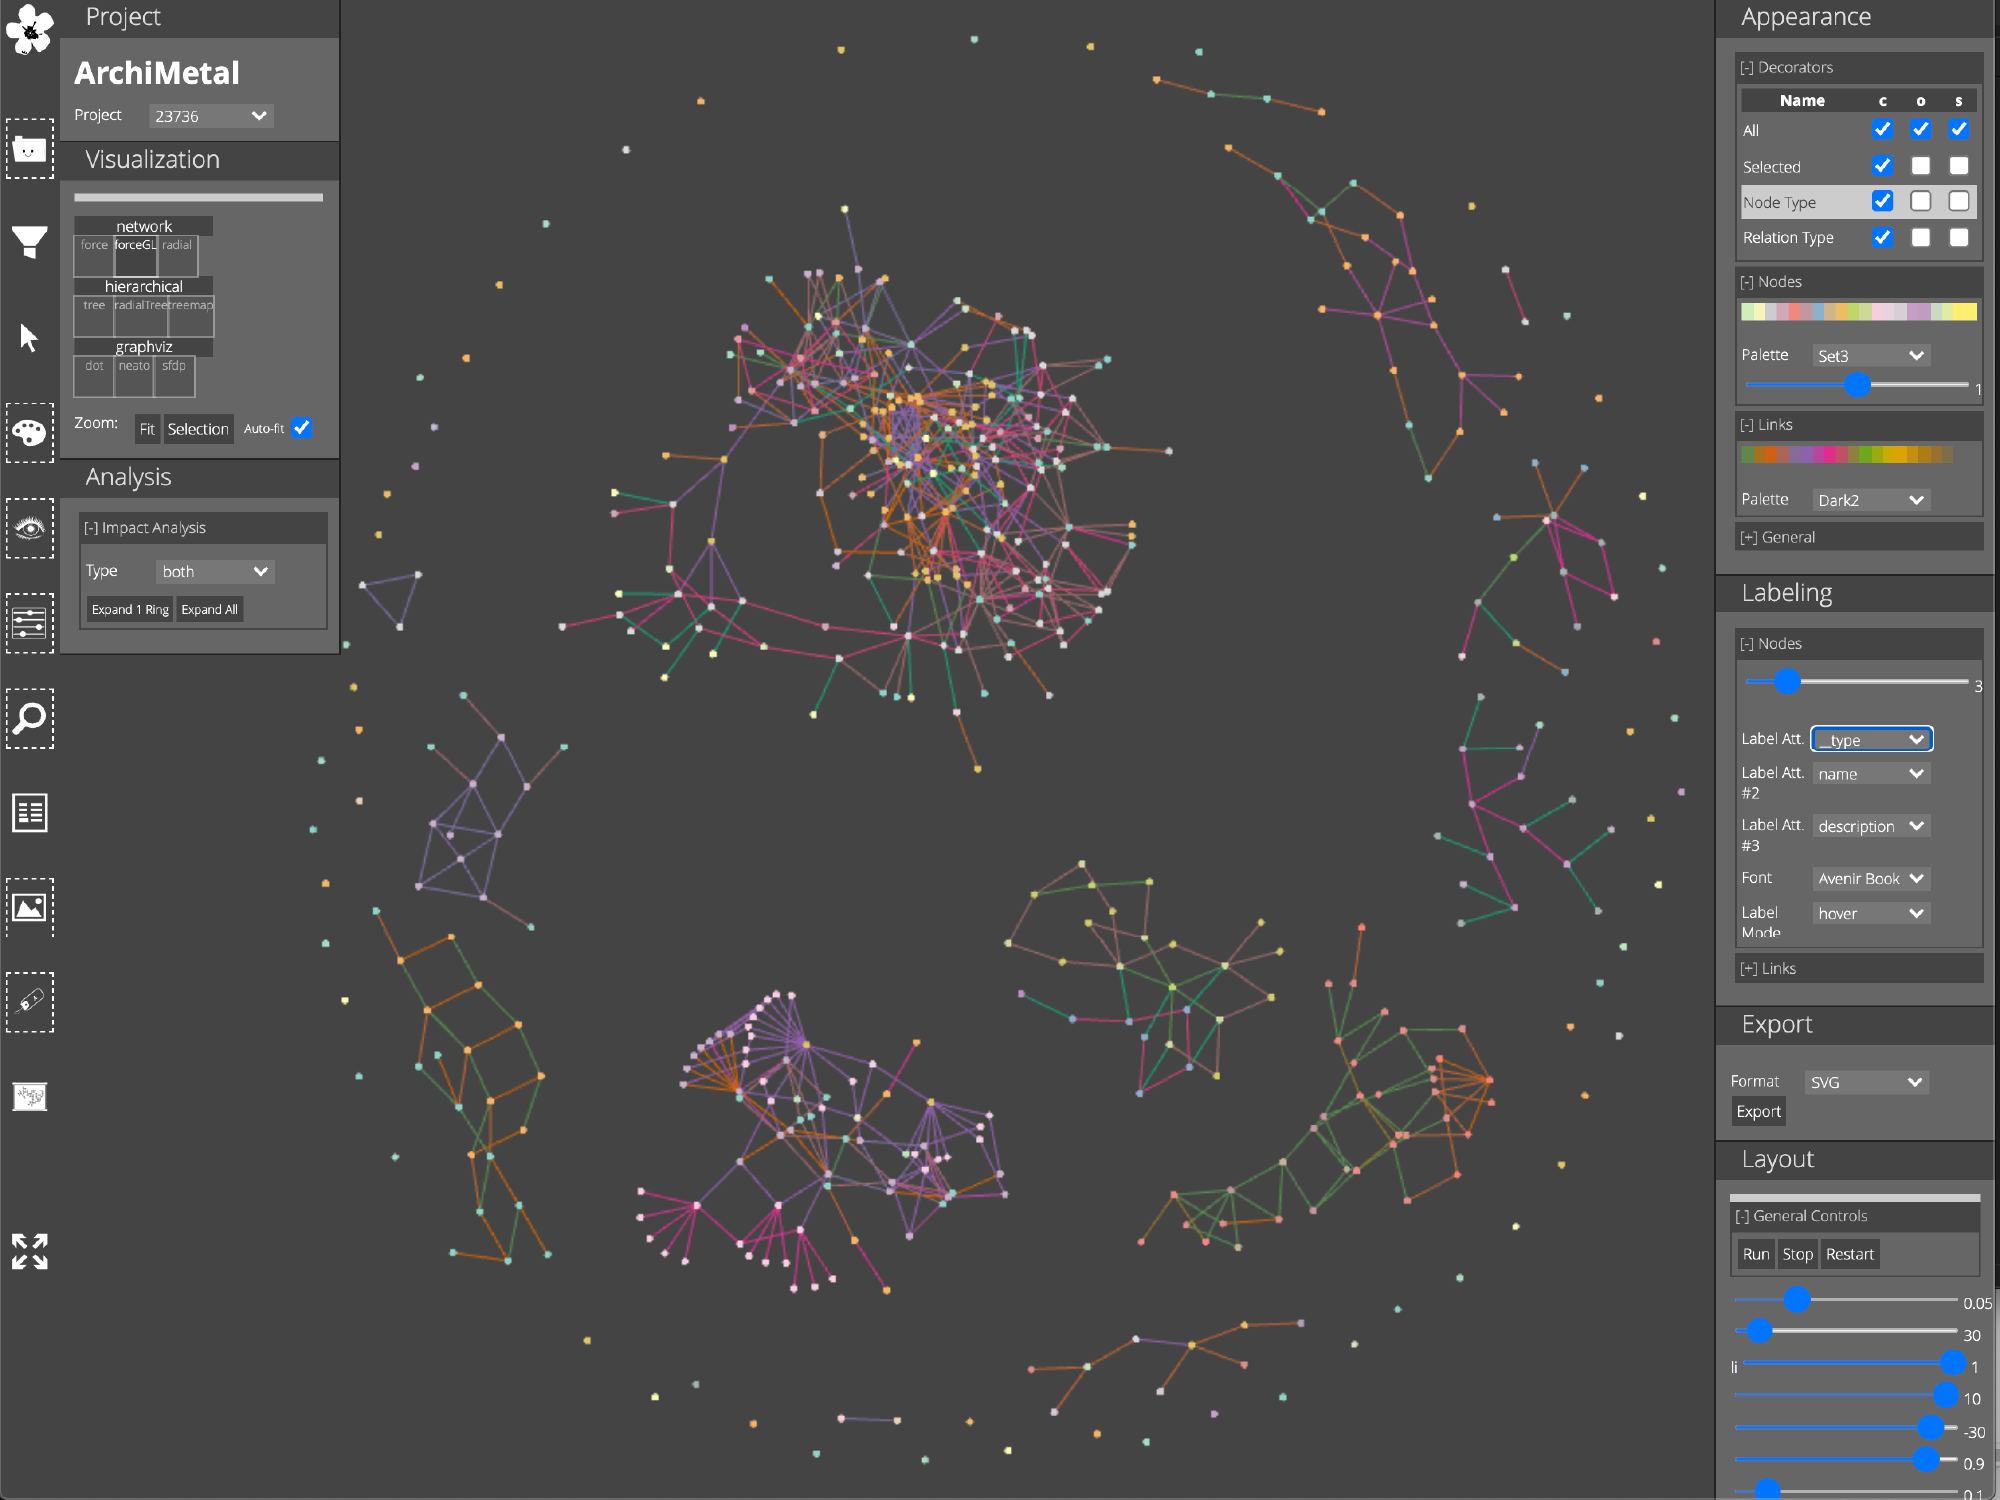
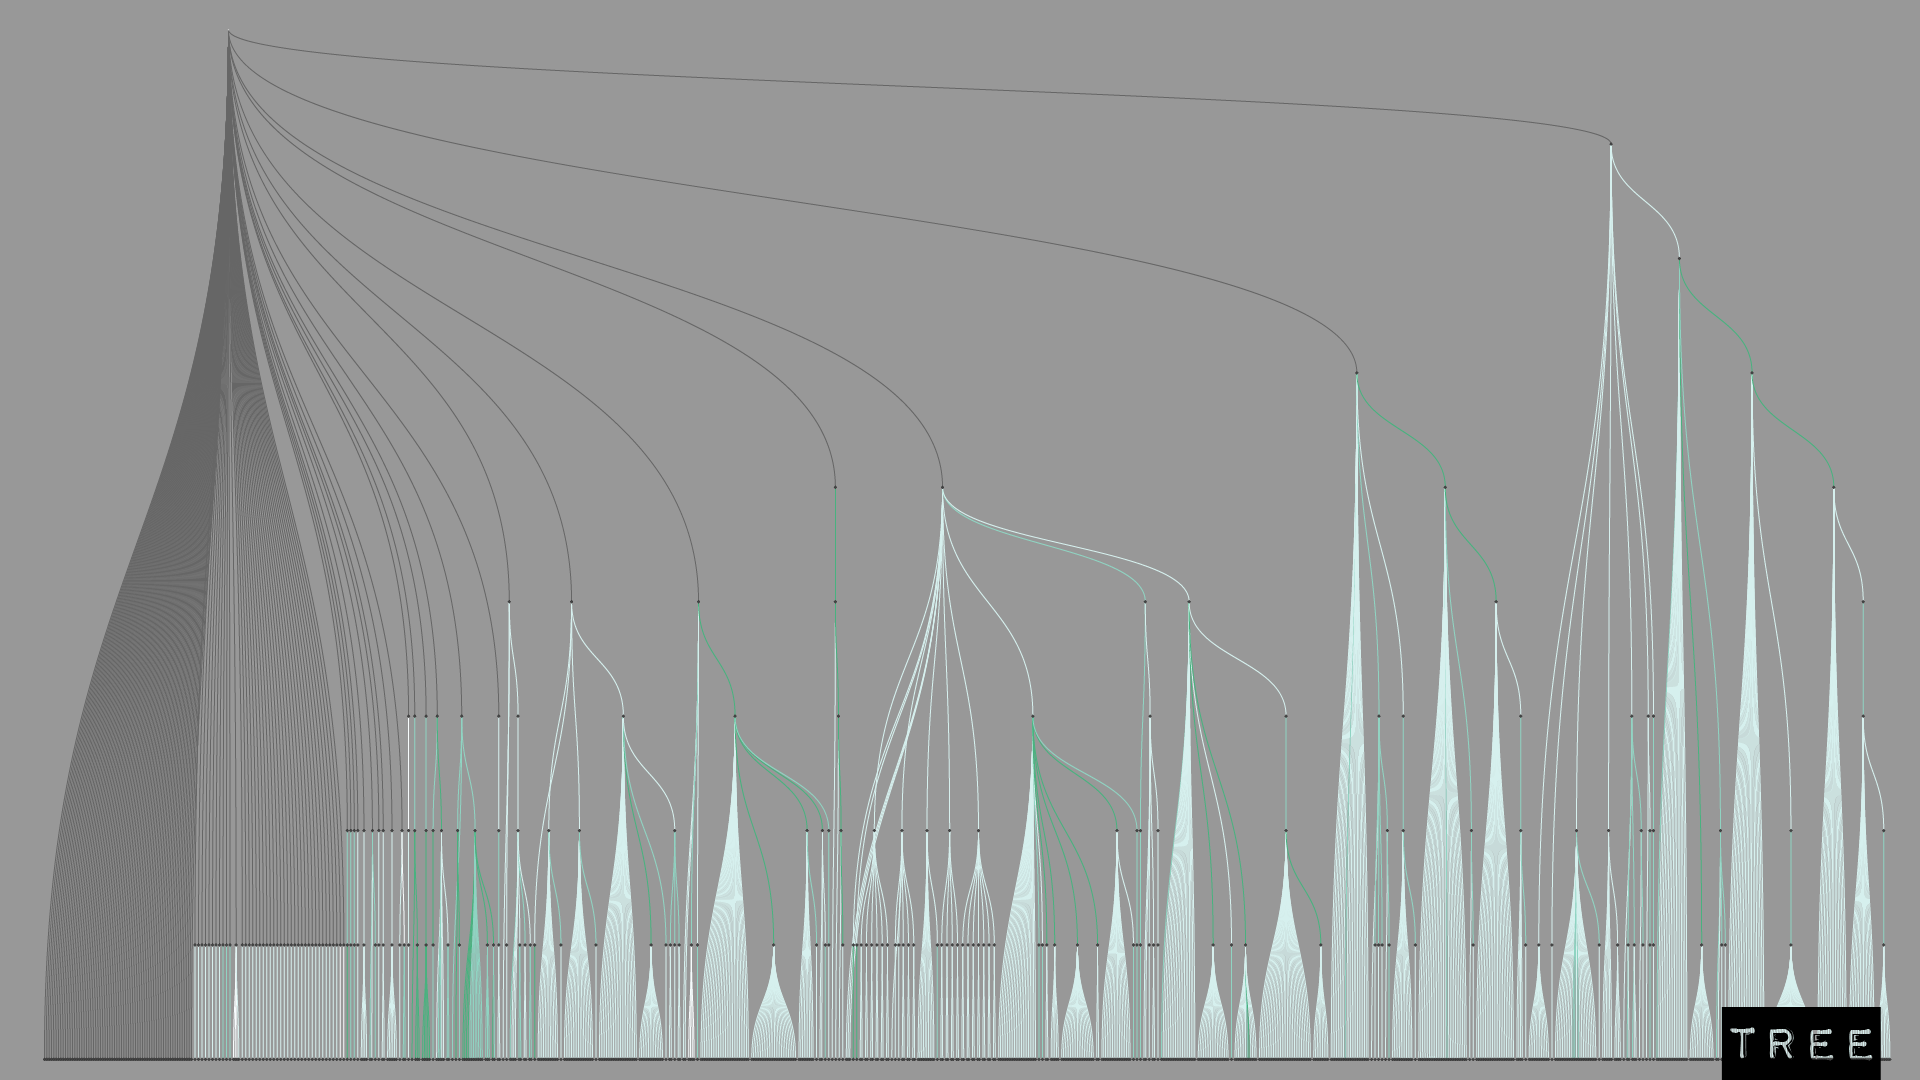
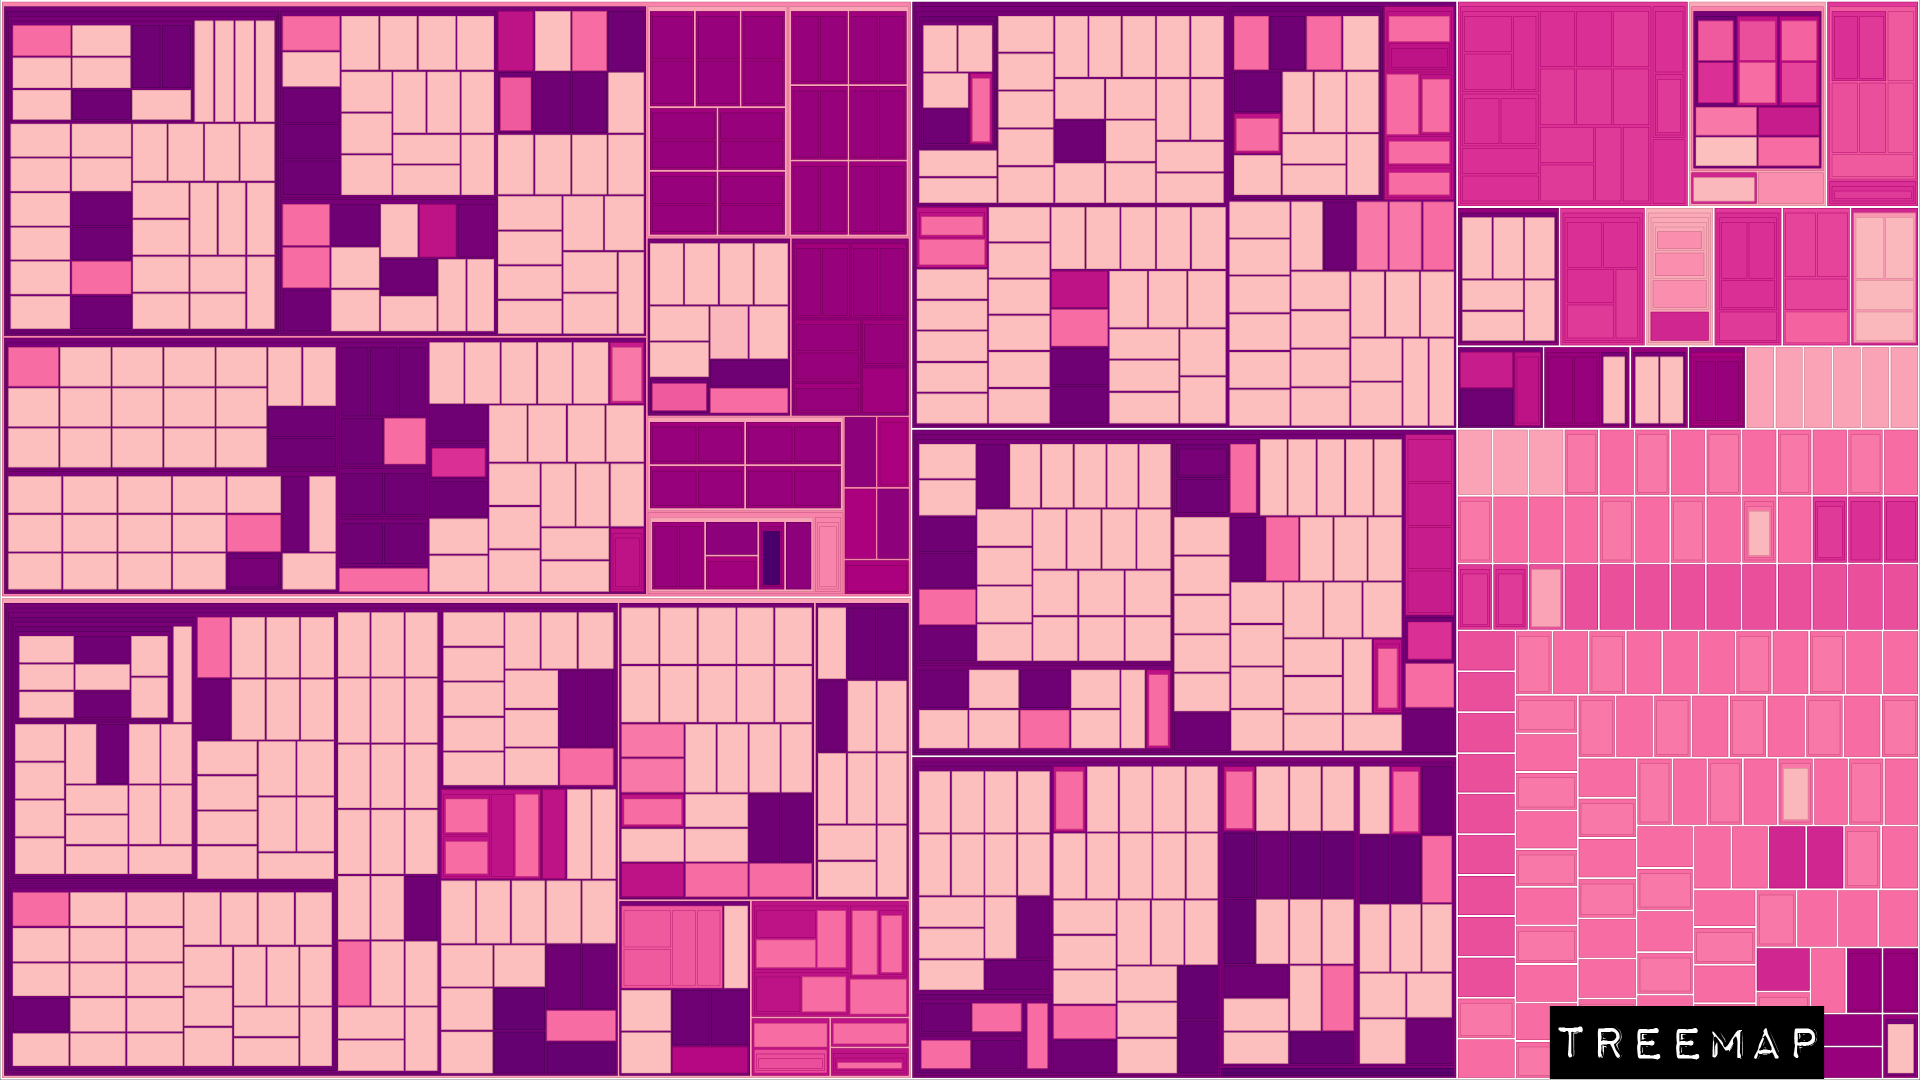
Data Visualization
Network-based
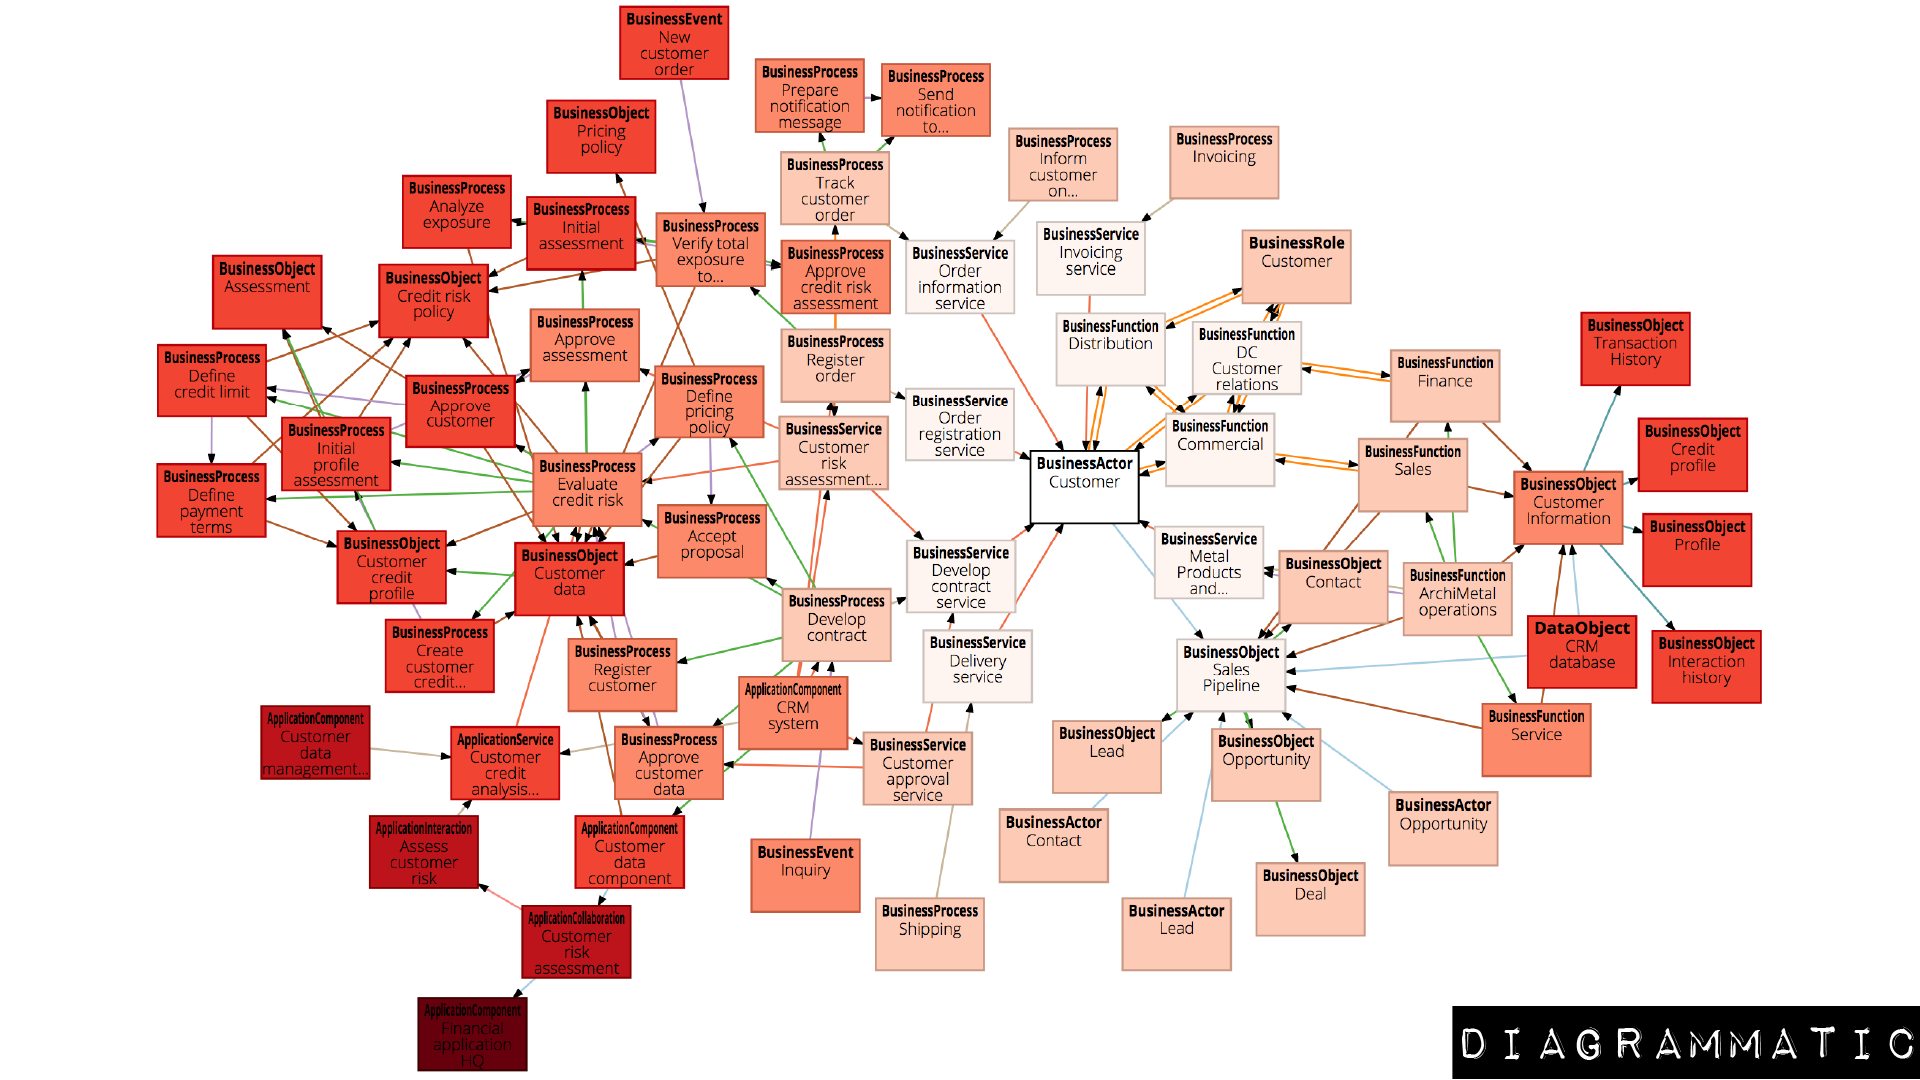
Radial
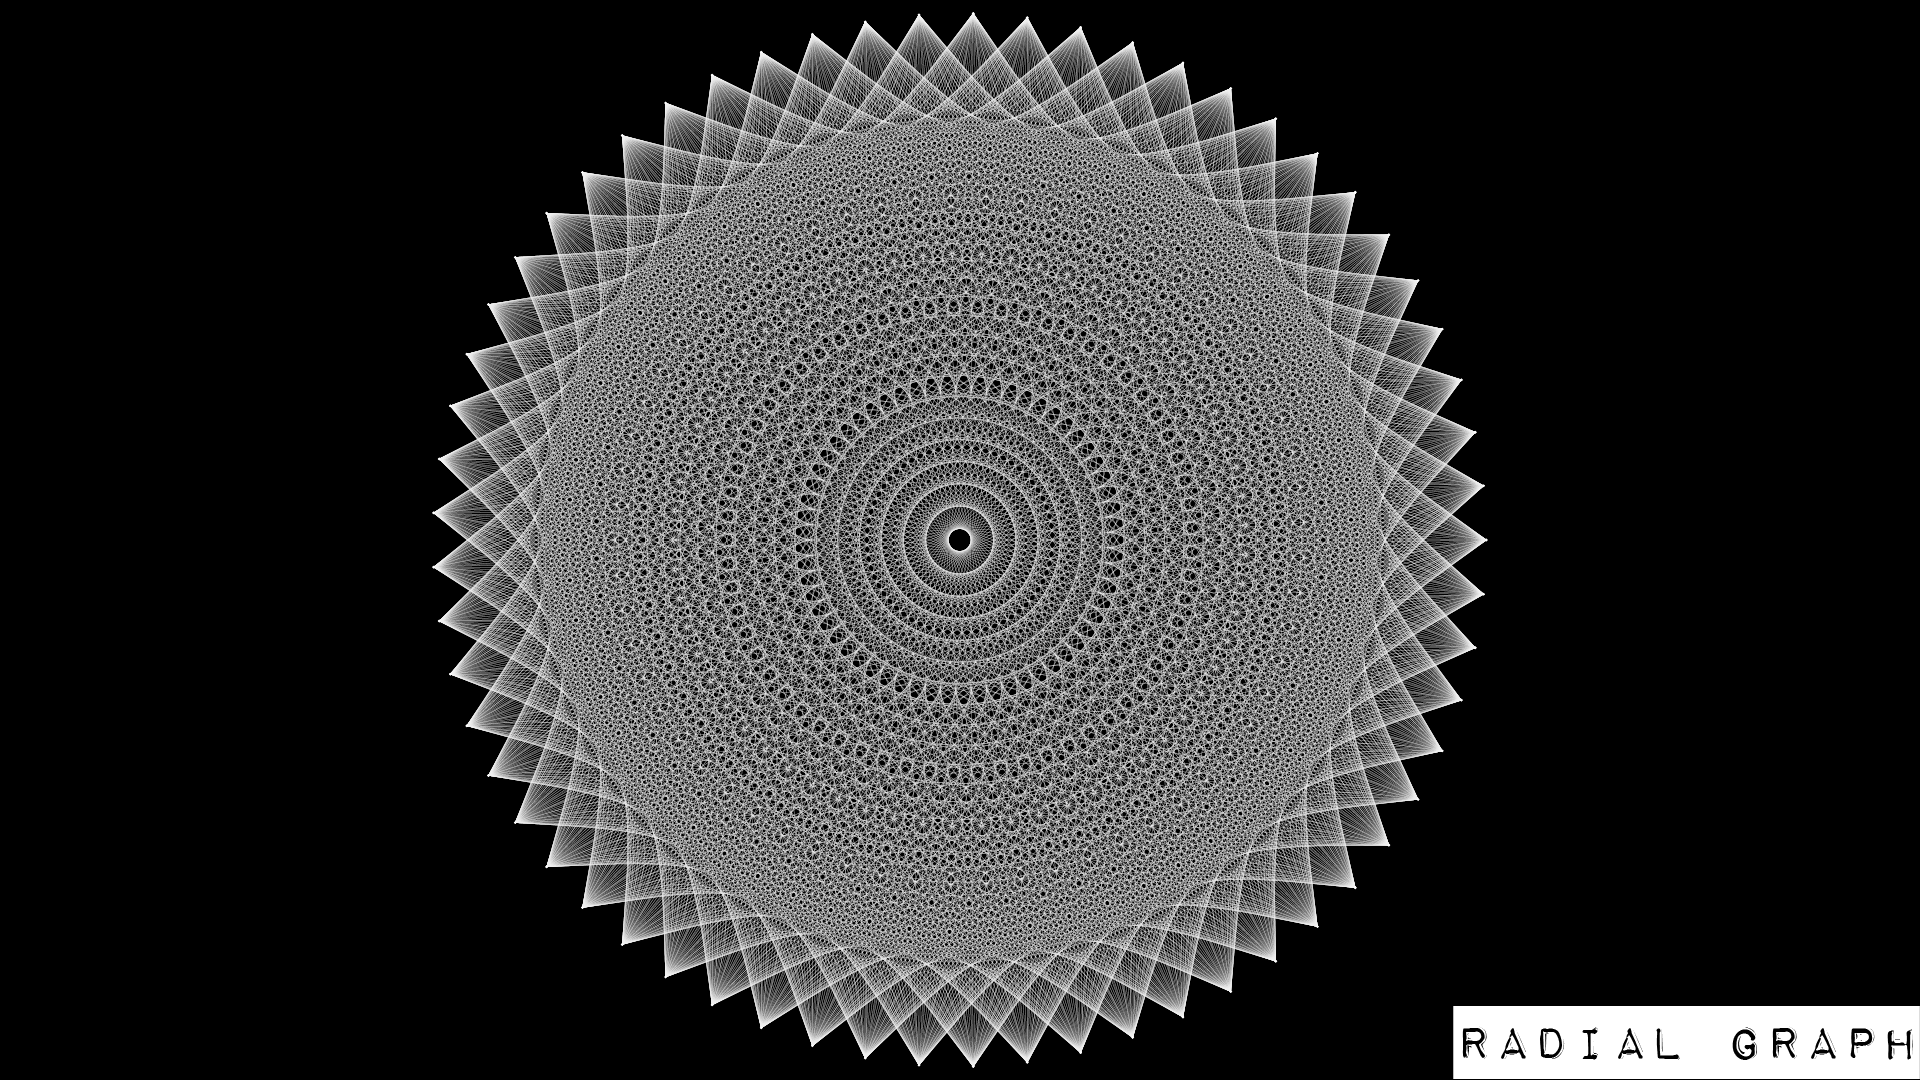
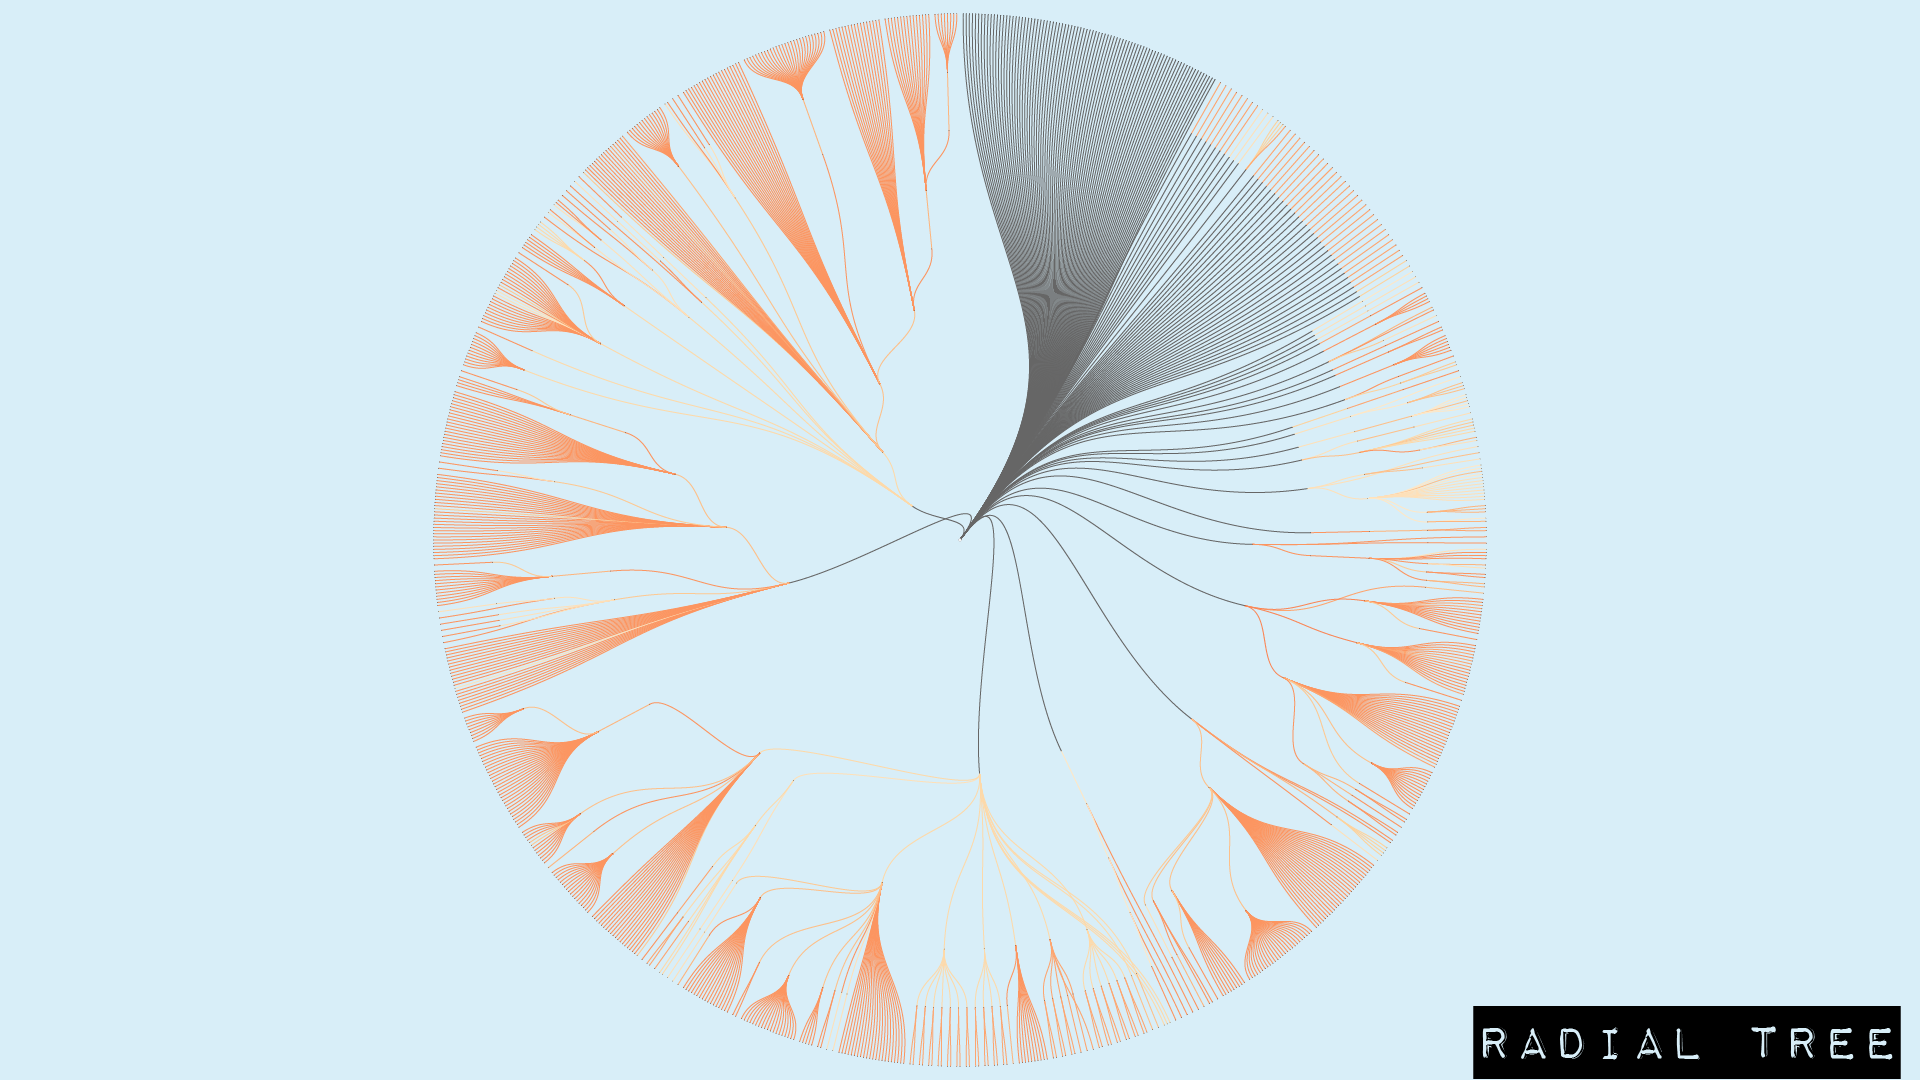
Hierarchical
UX Design
An critical aspect of the tool is the interaction mechanisms for exploration.
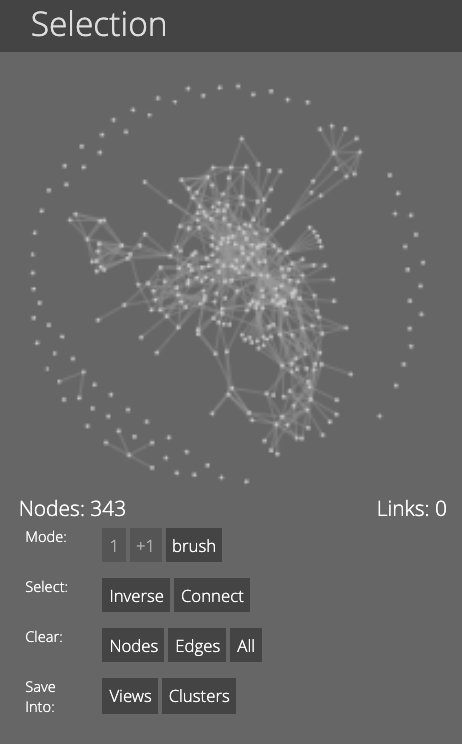
Selection
Interactive selection of individual elements and relationships, brushing:
Incremental selection along paths of the network:
Exploration
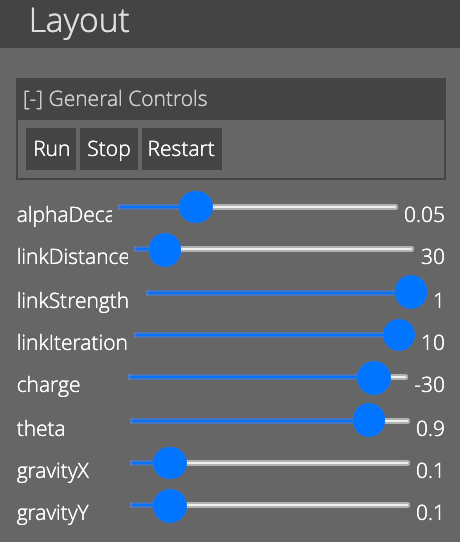
Mechanisms for modifying the parameters of layout algorithms:
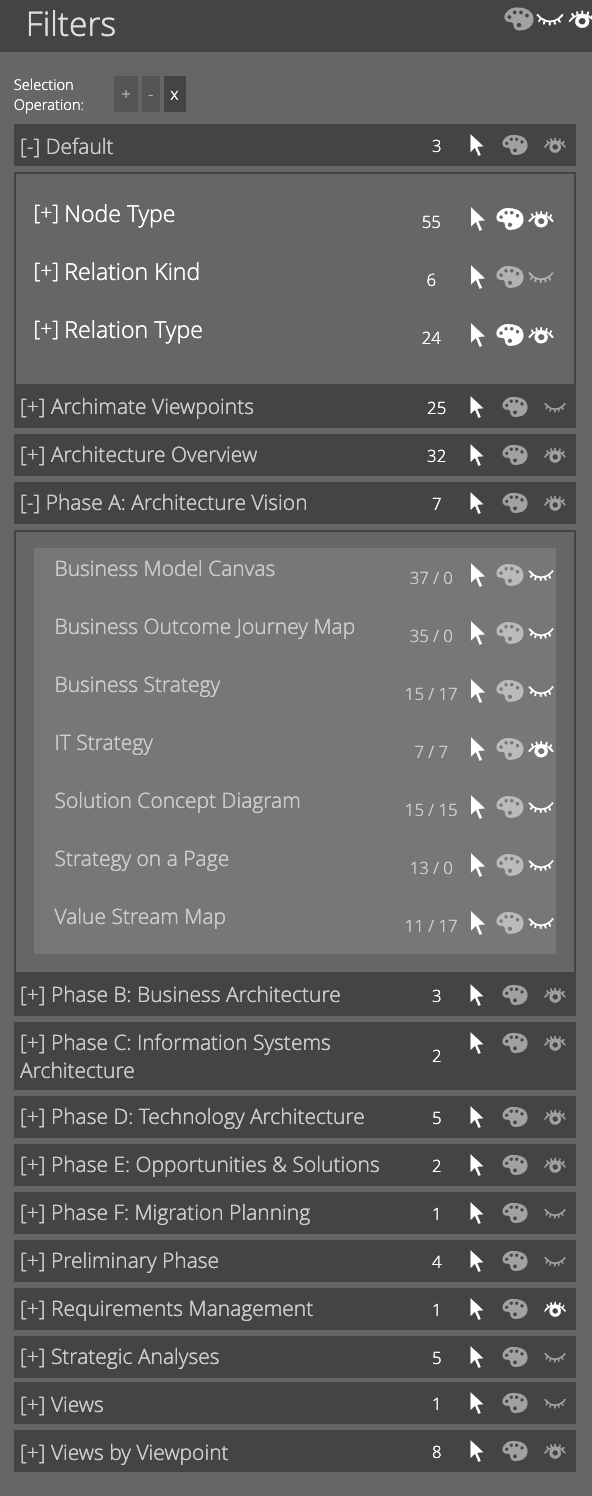
Filters that hide/show the different fragments of the network:
Communication
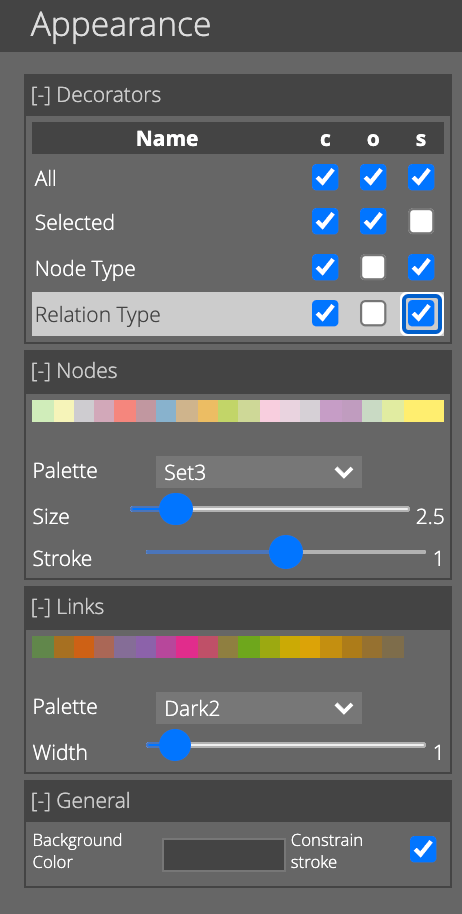
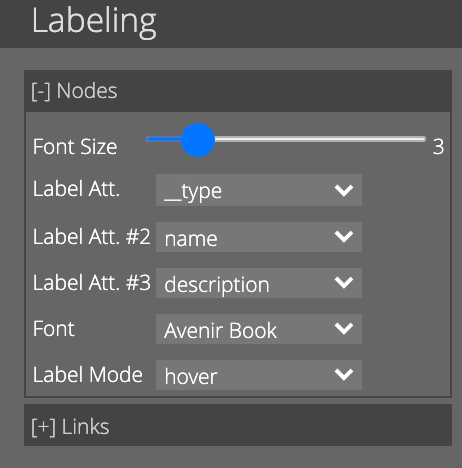
Easy modification of Visual Attributes such as color, size, opacity:
Step-by-step reconstruction of an exploration:
Selection of the View fragments:
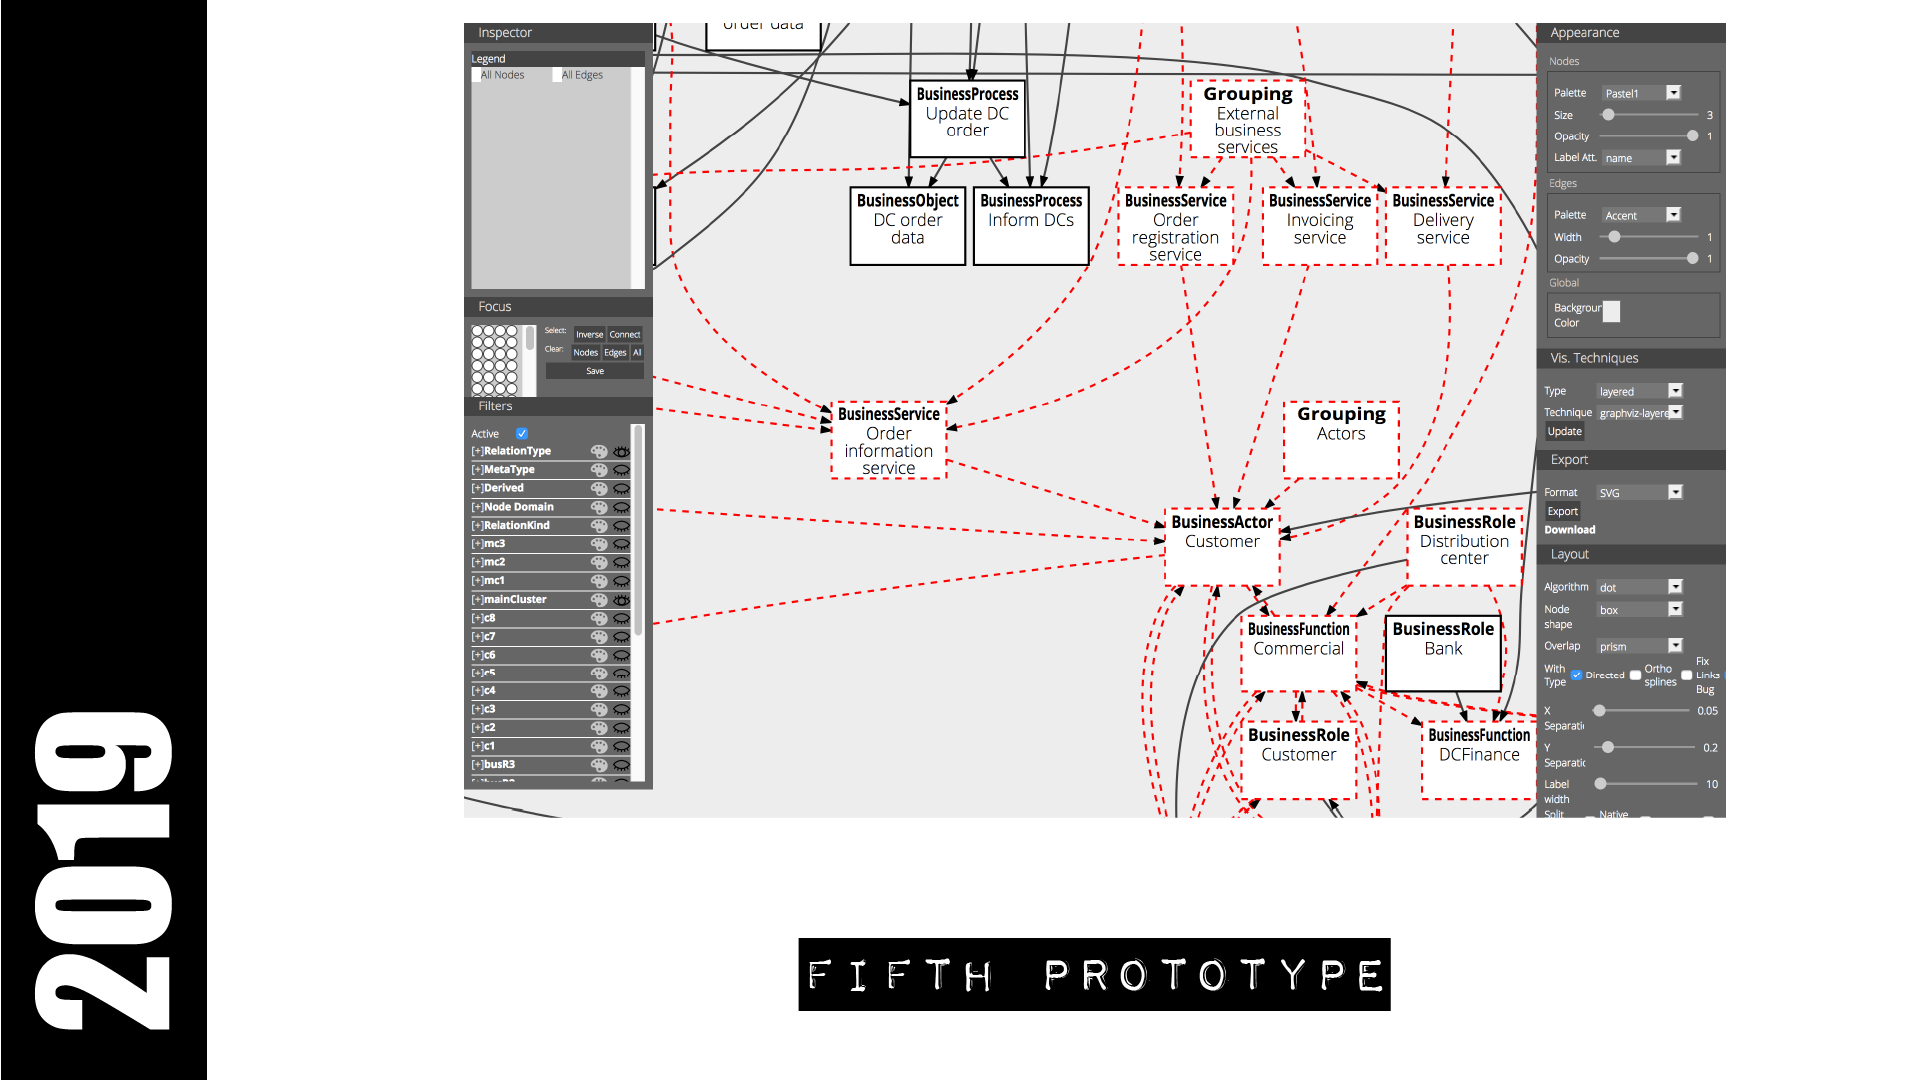
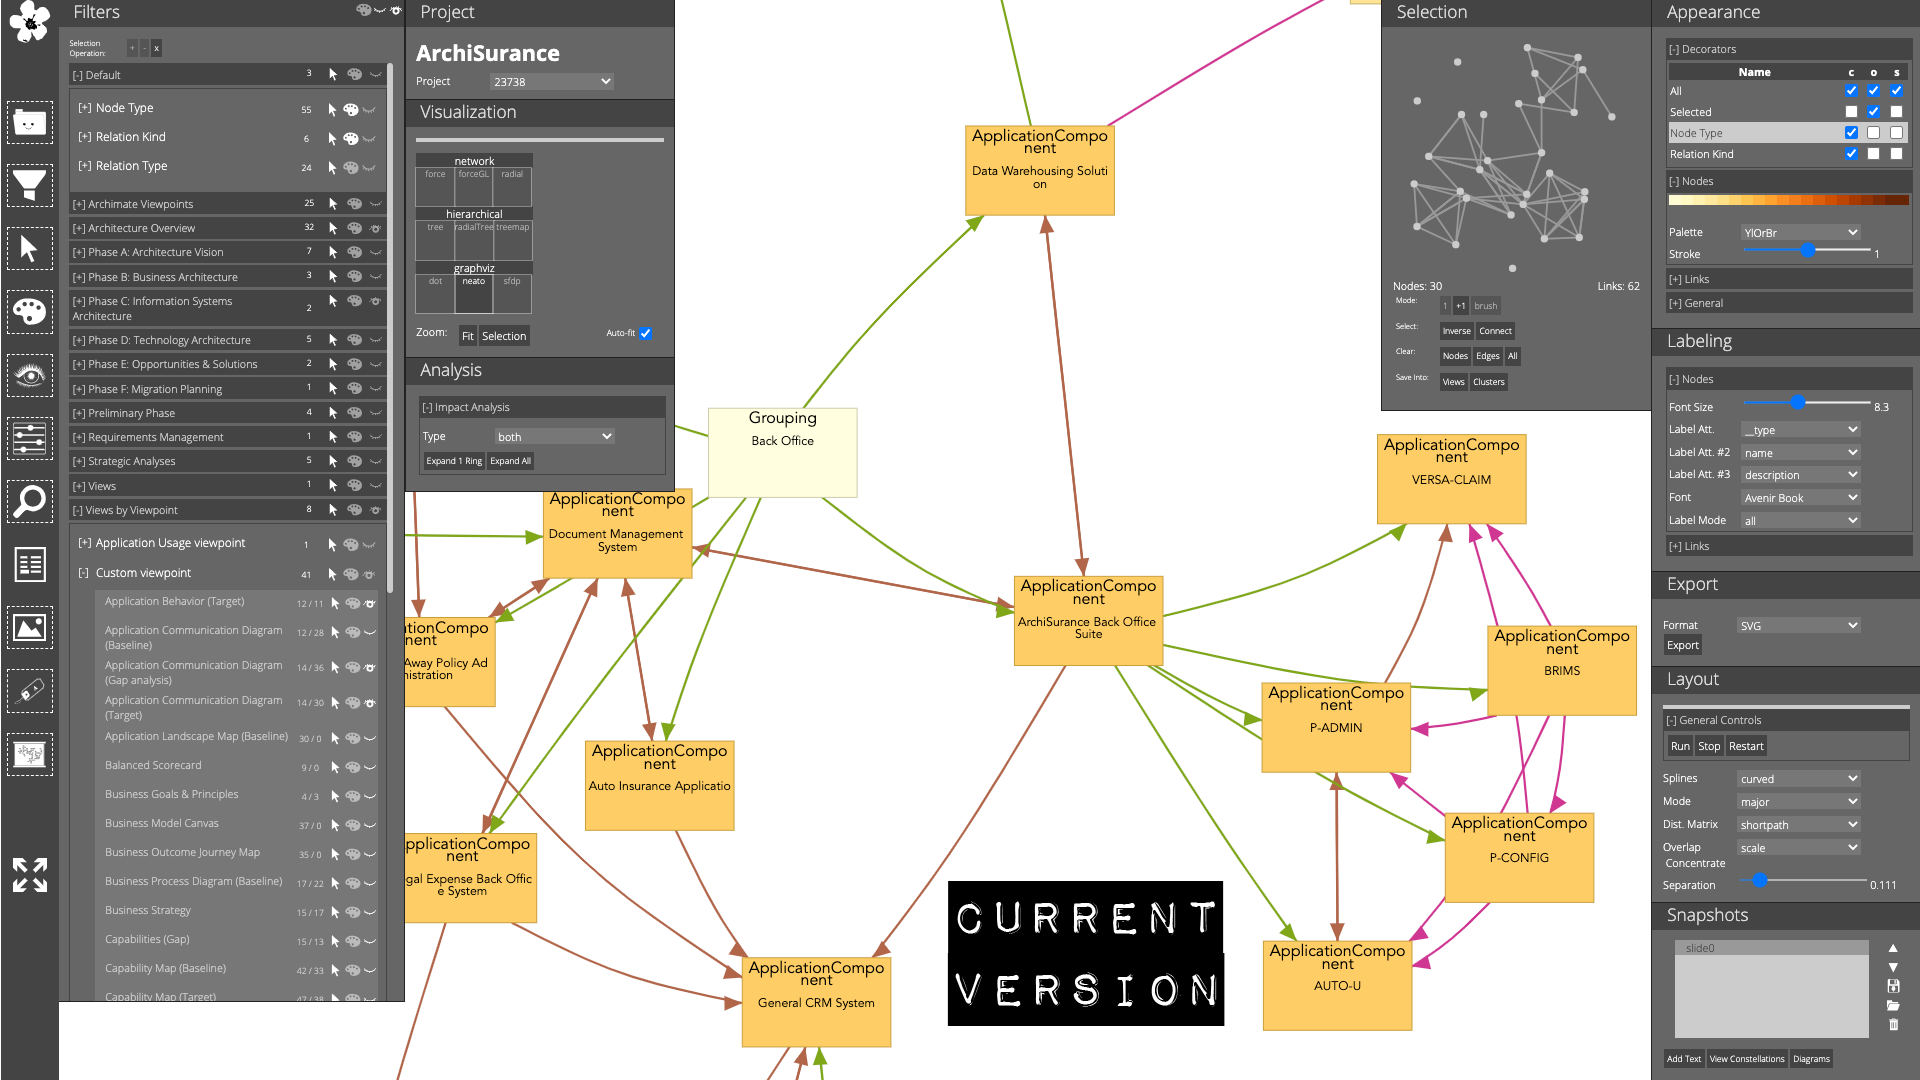
UI Design
There are several panels for manipulating different interactive aspects of the tool: The appearance of elements and relationships, layout parameters, Views and filters:

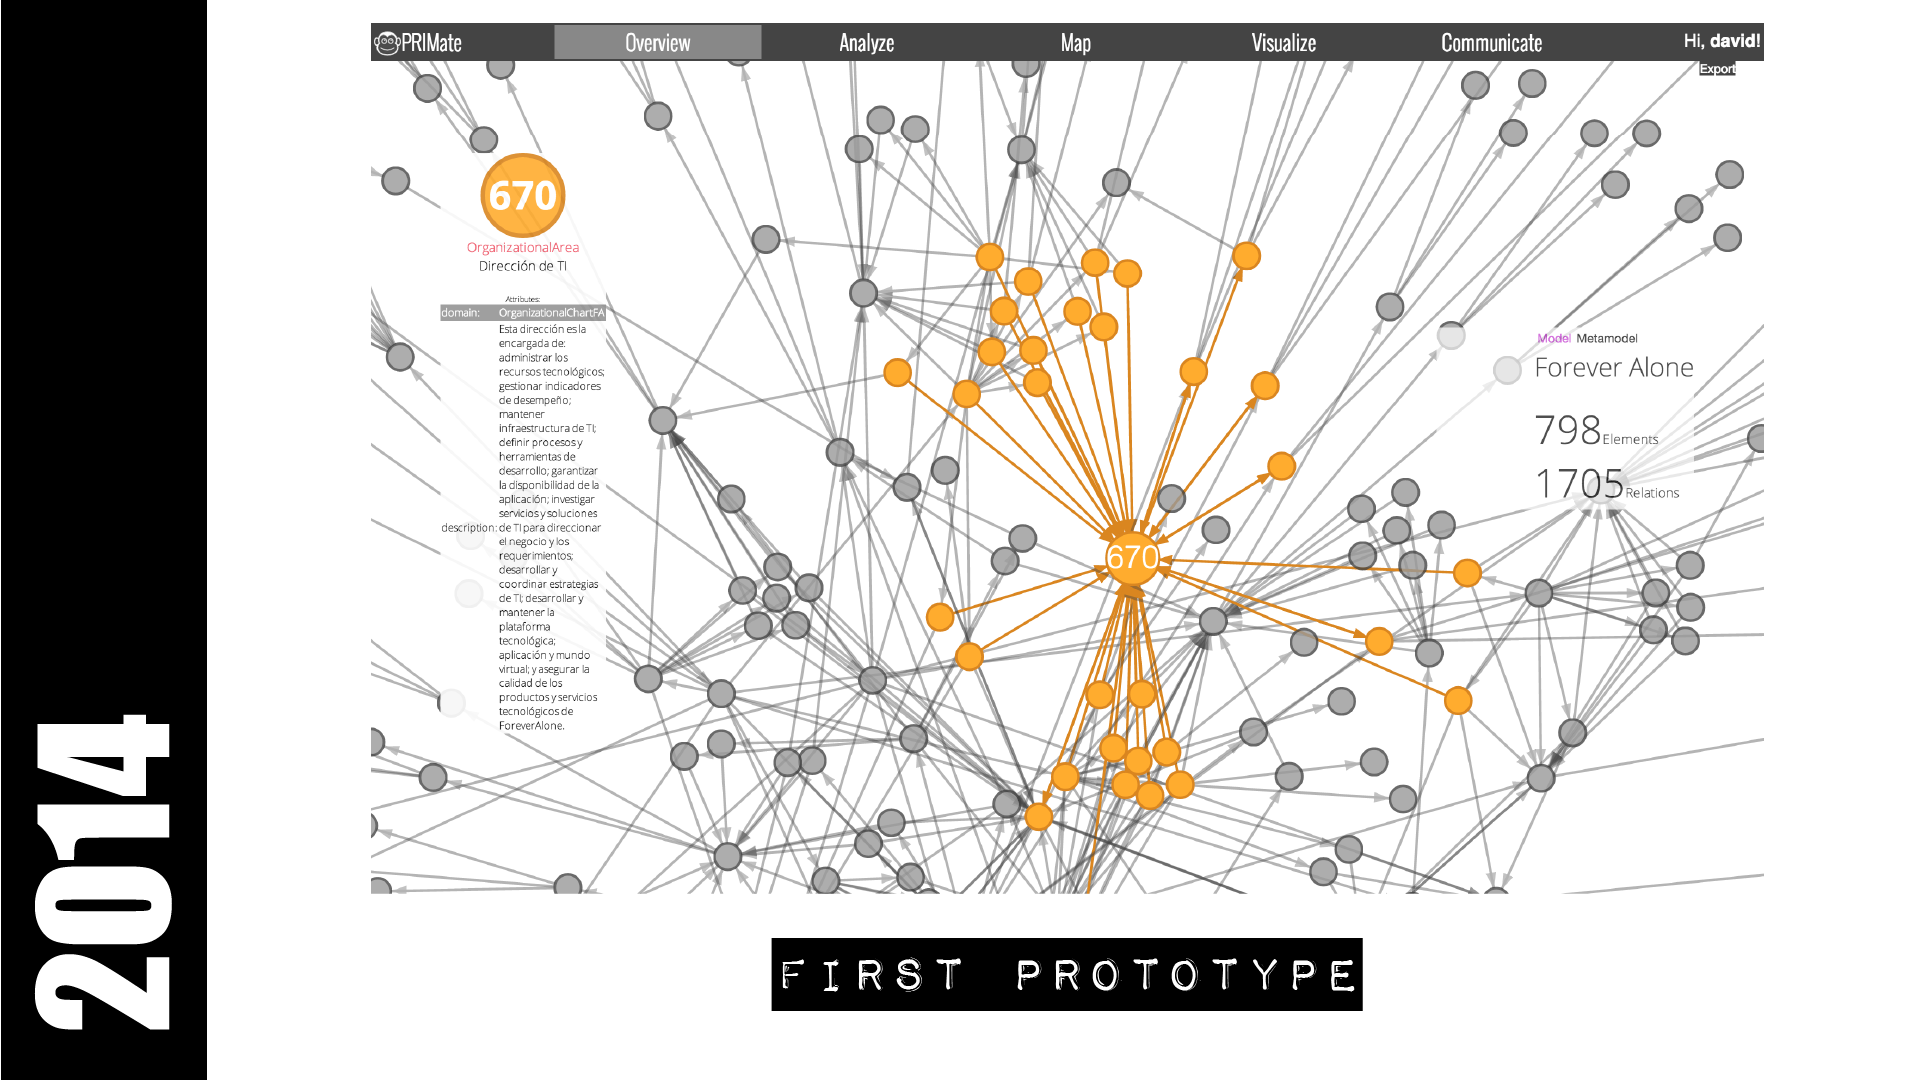
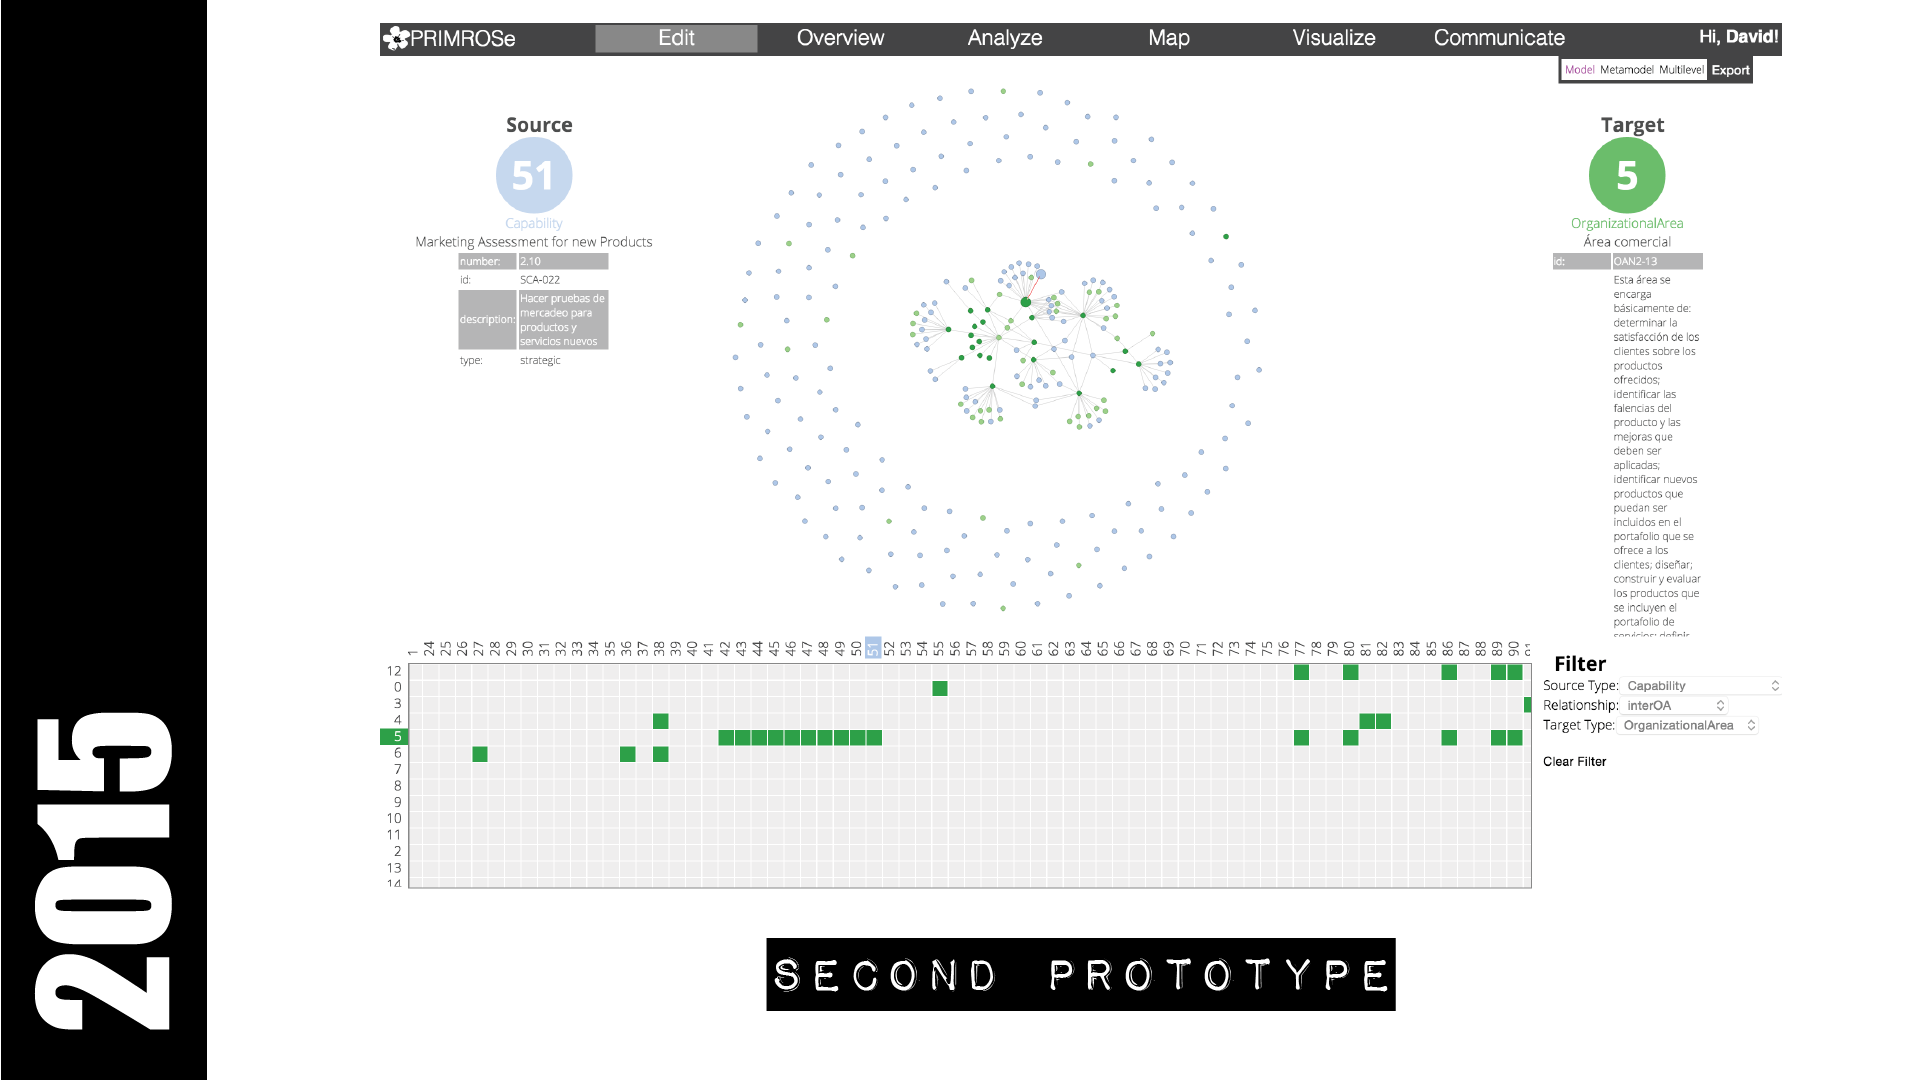
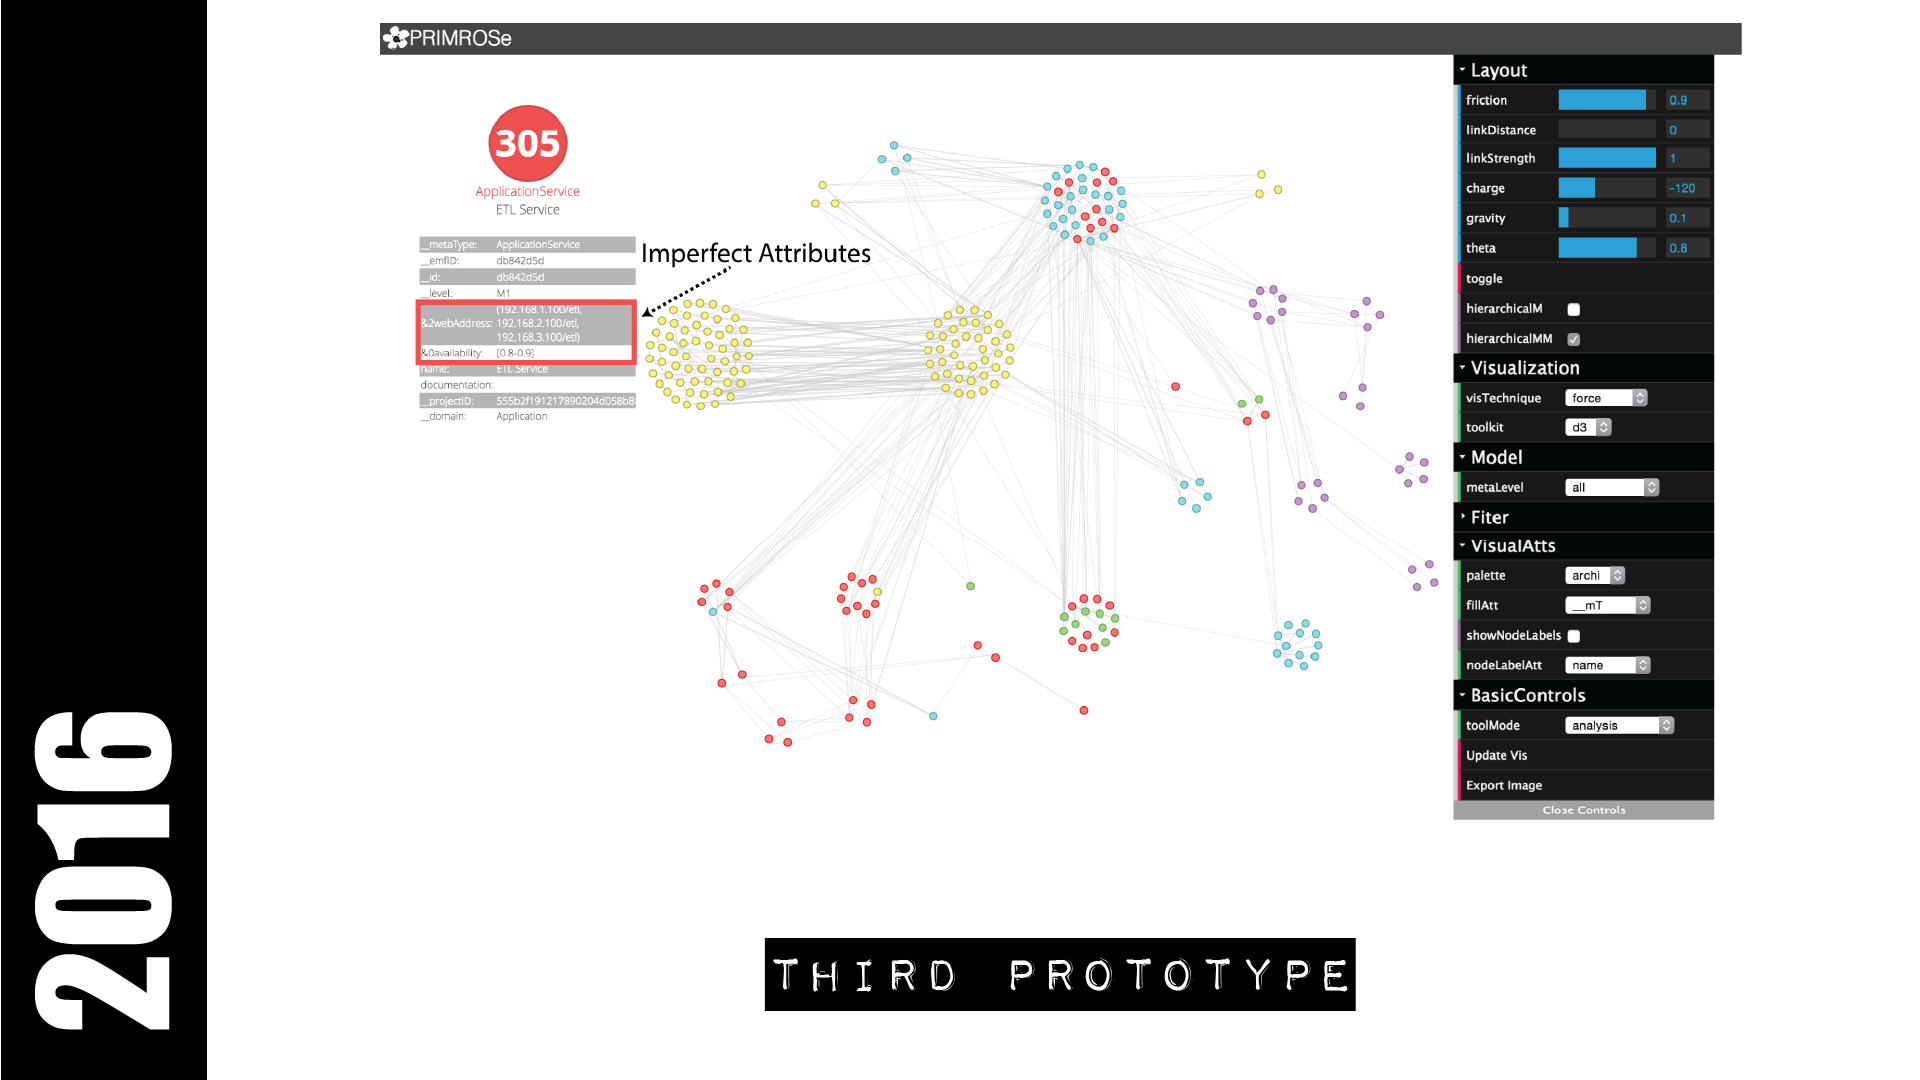
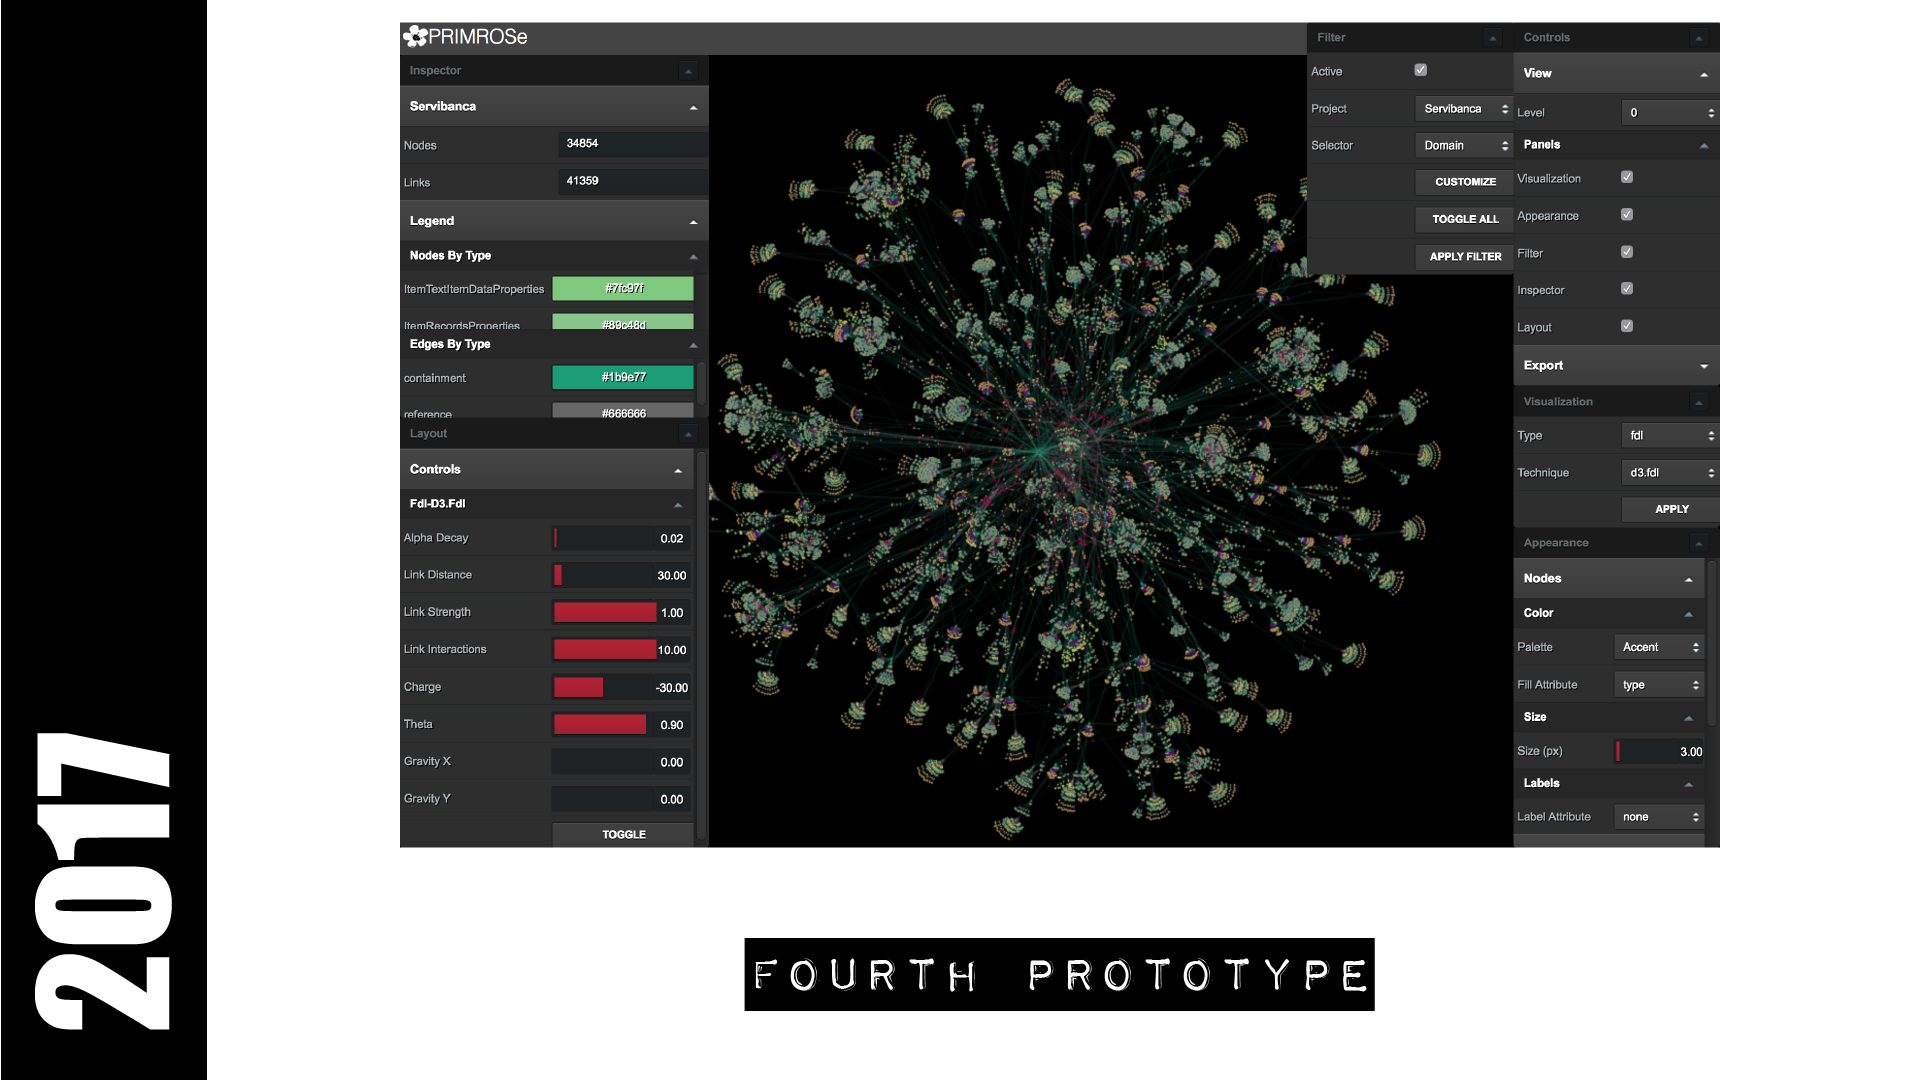
Evolution of the tool